LaMSS, Laboratory of Movement & Sport Science
Director: Dr. Jacopo Vitale
OVERVIEW

Chronobiology is the science that examines the biological rhythms in humans, animals and plants. A rhythm is defined as the time structure that characterizes any biologic entity exhibiting one or several of the frequencies. We aim to study the seasonal variations of Vitamin D, which is an essential hormone for bone metabolism and health, and it was observed that this marker had a clear circannual rhythm with an acrophase in months with longer photoperiod, both in healthy subjects, athletes, and patients affected by intervertebral disc degeneration. Our studies focus also the attention on the chronotype effect, meant as the individual’s predisposition toward morningness or eveningness, on actigraphy-based sleep behaviour and on the psycho-physiological responses to physical activity. The correct chronobiologic approach in the study of seasonal variations of bone and muscle metabolism and the chronotype effect could be decisive factors for the athletes’ health. Furthermore, since traumatic and overuse injuries are very common both in team and individual sports, we examine the distribution of injuries among athletes (and associated risk factors) and the physiological responses to high-intensity interval training (HIIT) with the aim to promote more specific injury prevention strategies. In particular, sleep behavior is studied, through actigraphy, as a crucial physiological adaptation to the training stimulus. Populations of professional soccer, volleyball, basketball, rugby, ski athletes and cyclists are investigated.
In conclusion, a novel study concerning “sarcopenia” status and the risk of falls in osteoporotic women aged over 60 years old is conducted by this research unit.
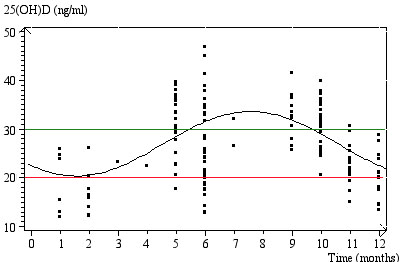
Circannual rhythm of Vitamin D (25(OH)D) in a cohort of top-level professional athletes. The cosine mathematical function that best fits the data as a function of time is f(t) = M + A cos (ωt + Ø) and three characteristics of the rhythm are described: Ø, acrophase; A, amplitude and M, MESOR. Red line represents the upper limit of deficiency level (20 ng/mL); the green line represents the upper limit of insufficiency level (30 ng/mL).
